Google Classroom
GeoGebra
GeoGebra Klaslokaal
Aanmelden
Zoek
Google Classroom
GeoGebra
GeoGebra Klaslokaal
Schets
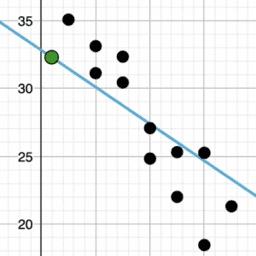
Describing Trends in Scatter Plots: IM 8.6.5
Lesson 8.6.5
Practice 8.6.5
Describing Trends in Scatter Plots: IM 8.6.5
Auteur:
GeoGebra Classroom Activities
,
IM 6 – 8 Math
Onderwerp:
Algebra
,
Correlatie
,
Vergelijkingen
,
Lineaire vergelijkingen
,
Lineaire Regressie
,
Statistiek
“Describing Trends in Scatter Plots”
from IM Grade 8 by
Open Up Resources
and Illustrative Mathematics. Licensed under the
Creative Commons Attribution 4.0 license
.
Inhoudstafel
Lesson 8.6.5
IM 8.6.5 Lesson: Describing Trends in Scatter Plots
Practice 8.6.5
IM 8.6.5 Practice: Describing Trends in Scatter Plots
Volgende
IM 8.6.5 Lesson: Describing Trends in Scatter Plots
Nieuw didactisch materiaal
Poorly Drawn Parallelograms
Icosahedron1
Construct a Conic
Rotating rings: Community Showcase
Variation Theory Parallelogram Proofs
Ontdek materiaal
En forme - EN - 3e cycle - à modifier
NotSamePlane
Extending Trig beyond 90
DrakeG2HomeworkEqTri
Transformation Golf 9 Hole Course (just 4 holes so far))
Ontdek onderwerpen
Zwaartepunt
Sinus
Verschil en helling
Trapezium
Voorwaardelijke kans