Google Classroom
GeoGebra
GeoGebra Classroom
Abrir sesión
Buscar
Google Classroom
GeoGebra
GeoGebra Classroom
Esquema
Estatística
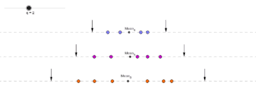
Statistical Outliers Impossible in Small Samples
Outlier Influence
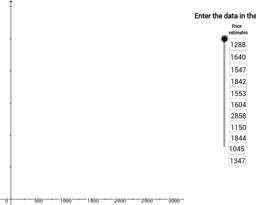
Estimate using Box Plot
Outliers
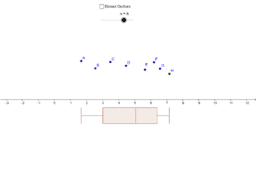
Dynamic Boxplot
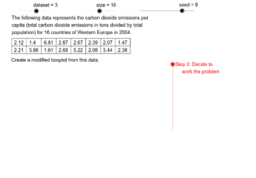
Step Through Modified Boxplot Construction
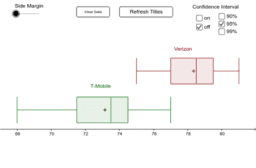
Generate Two Boxplots
Boxplot Game
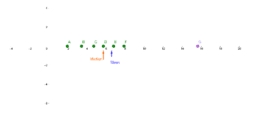
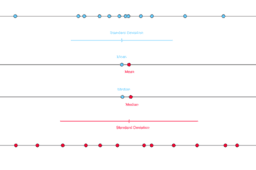
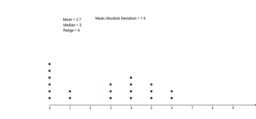
Mean, Median, and Standard Deviation
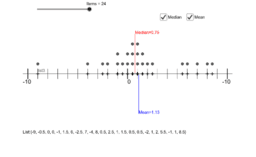
Dot Plot Interactive
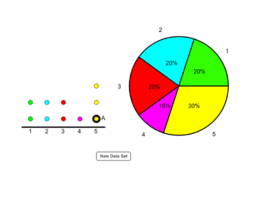
AQR Section 16: Creating a Pie Chart From a Dot Plot
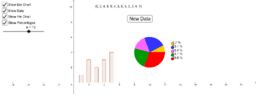
Bar Charts and Pie Charts
Dot Plot Tool
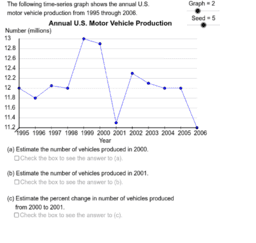
Time Series Analysis Problems
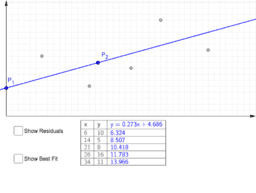
Least Squares Demonstration
Estatística
Autor:
Palmerim
Statistical Outliers Impossible in Small Samples
Outlier Influence
Estimate using Box Plot
Outliers
Dynamic Boxplot
Step Through Modified Boxplot Construction
Generate Two Boxplots
Boxplot Game
Mean, Median, and Standard Deviation
Dot Plot Interactive
AQR Section 16: Creating a Pie Chart From a Dot Plot
Bar Charts and Pie Charts
Dot Plot Tool
Time Series Analysis Problems
Least Squares Demonstration
Siguiente
Statistical Outliers Impossible in Small Samples
Nuevos recursos
Critérios de Divisibilidade
Exemplos de tarefas com feedbacks automáticos na plataforma GeoGebra
Diferentes Feedbacks em tarefas feitas na plataforma GeoGebra
Como fazer uma tarefa de equação do 1º grau com feedback automático no GeoGebra?
Demonstração do critério de divisibilidade por 11
Descubrir recursos
Quadrado da soma
Baricentro
Geometria Plana – Polígonos
Prisma de base triangular-Volume
TRABALHO DE MATEMÁTICA
Descubre temas
Cuadriláteros
Cubo
Triángulos Isósceles
Gráfica de Funciones
Fracciones