Google Classroom
GeoGebra
GeoGebra Classroom
Sign in
Search
Google Classroom
GeoGebra
GeoGebra Classroom
Outline
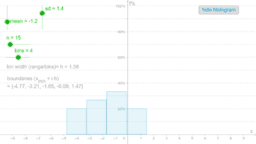
statistics
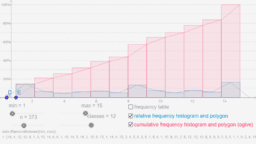
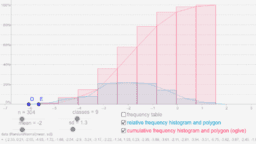
histograms
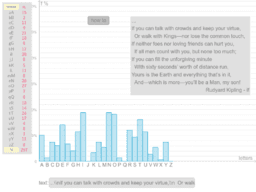
distribution of letters
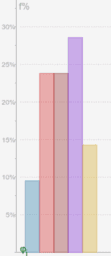
pie chart
Practicing Statistical Calculation-1
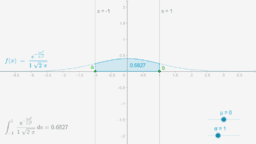
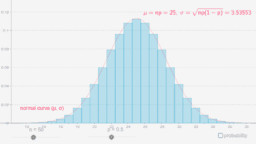
the bell curve
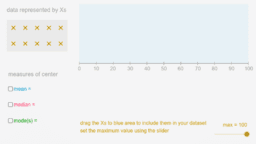
measures of center
pi digits
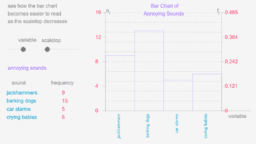
frequency scale
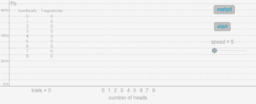
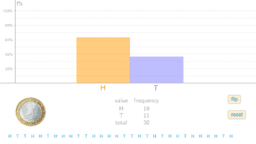
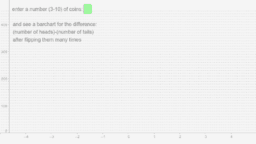
coin flipping-1
flipping a coin
binomial and normal
random data-1
random data-2
coin tossing simulation
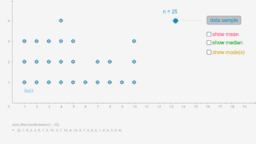
dotplot
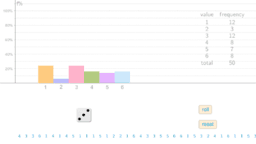
rolling a dice
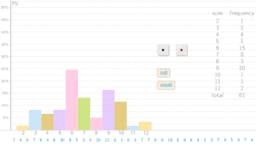
rolling two dice
statistics
Author:
Seddoh Marianne
,
sonom
histograms
distribution of letters
pie chart
Practicing Statistical Calculation-1
the bell curve
measures of center
pi digits
frequency scale
coin flipping-1
flipping a coin
binomial and normal
random data-1
random data-2
coin tossing simulation
dotplot
rolling a dice
rolling two dice
Next
histograms
New Resources
Poorly Drawn Parallelograms
Icosahedron1
Construct a Conic
Finding Average Rate of Change of a Function
alg2_05_05_01_applet_exp_2_flvs
Discover Resources
slider_campo
Square inscribed in a triangle
rombe_next_test2
Perpendicular Line Through a Point
im.g.3.13.2 Tangled Triangles (15)
Discover Topics
Trigonometric Functions
Fractions
Differential Calculus
Poisson Distribution
Probability