Google Classroom
GeoGebra
GeoGebra Classroom
Sign in
Search
Google Classroom
GeoGebra
GeoGebra Classroom
Outline
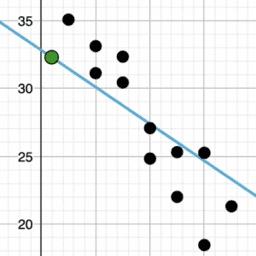
Describing Trends in Scatter Plots: IM 8.6.5
Lesson 8.6.5
Practice 8.6.5
Describing Trends in Scatter Plots: IM 8.6.5
Author:
GeoGebra Classroom Activities
,
IM 6 – 8 Math
Topic:
Algebra
,
Correlation
,
Equations
,
Linear Equations
,
Linear Regression
,
Scatter Plot
,
Statistics
“Describing Trends in Scatter Plots”
from IM Grade 8 by
Open Up Resources
and Illustrative Mathematics. Licensed under the
Creative Commons Attribution 4.0 license
.
Table of Contents
Lesson 8.6.5
IM 8.6.5 Lesson: Describing Trends in Scatter Plots
Practice 8.6.5
IM 8.6.5 Practice: Describing Trends in Scatter Plots
Next
IM 8.6.5 Lesson: Describing Trends in Scatter Plots
New Resources
Variation Theory Parallelogram Proofs
Poorly Drawn Parallelograms 3
Construct a Conic
alg2_05_05_01_slider_practice_flvs
Tutorial: Create lists of numbers and objects
Discover Resources
Root Function Transformation Graph 4
Aula 3.3(b)- Aline, Paula e Roberta
Solve Linear Linear Fractions
Modul 15_B1_Amrin_SMAN 2 Baubau
Untitled
Discover Topics
Parabola
Upper and Lower Sum or Riemann Sum
Dilation
Circle
Special Points